Production Monitoring
LOCAL ONLY. The implemented path is frontguard monitor run by your own process, cron, or CI. A managed cloud scheduler is not generally available.
Use frontguard monitor to run synthetic visual checks against live production or staging URLs, record timestamped run history on disk, and dispatch webhook alerts when visual drift exceeds your threshold.
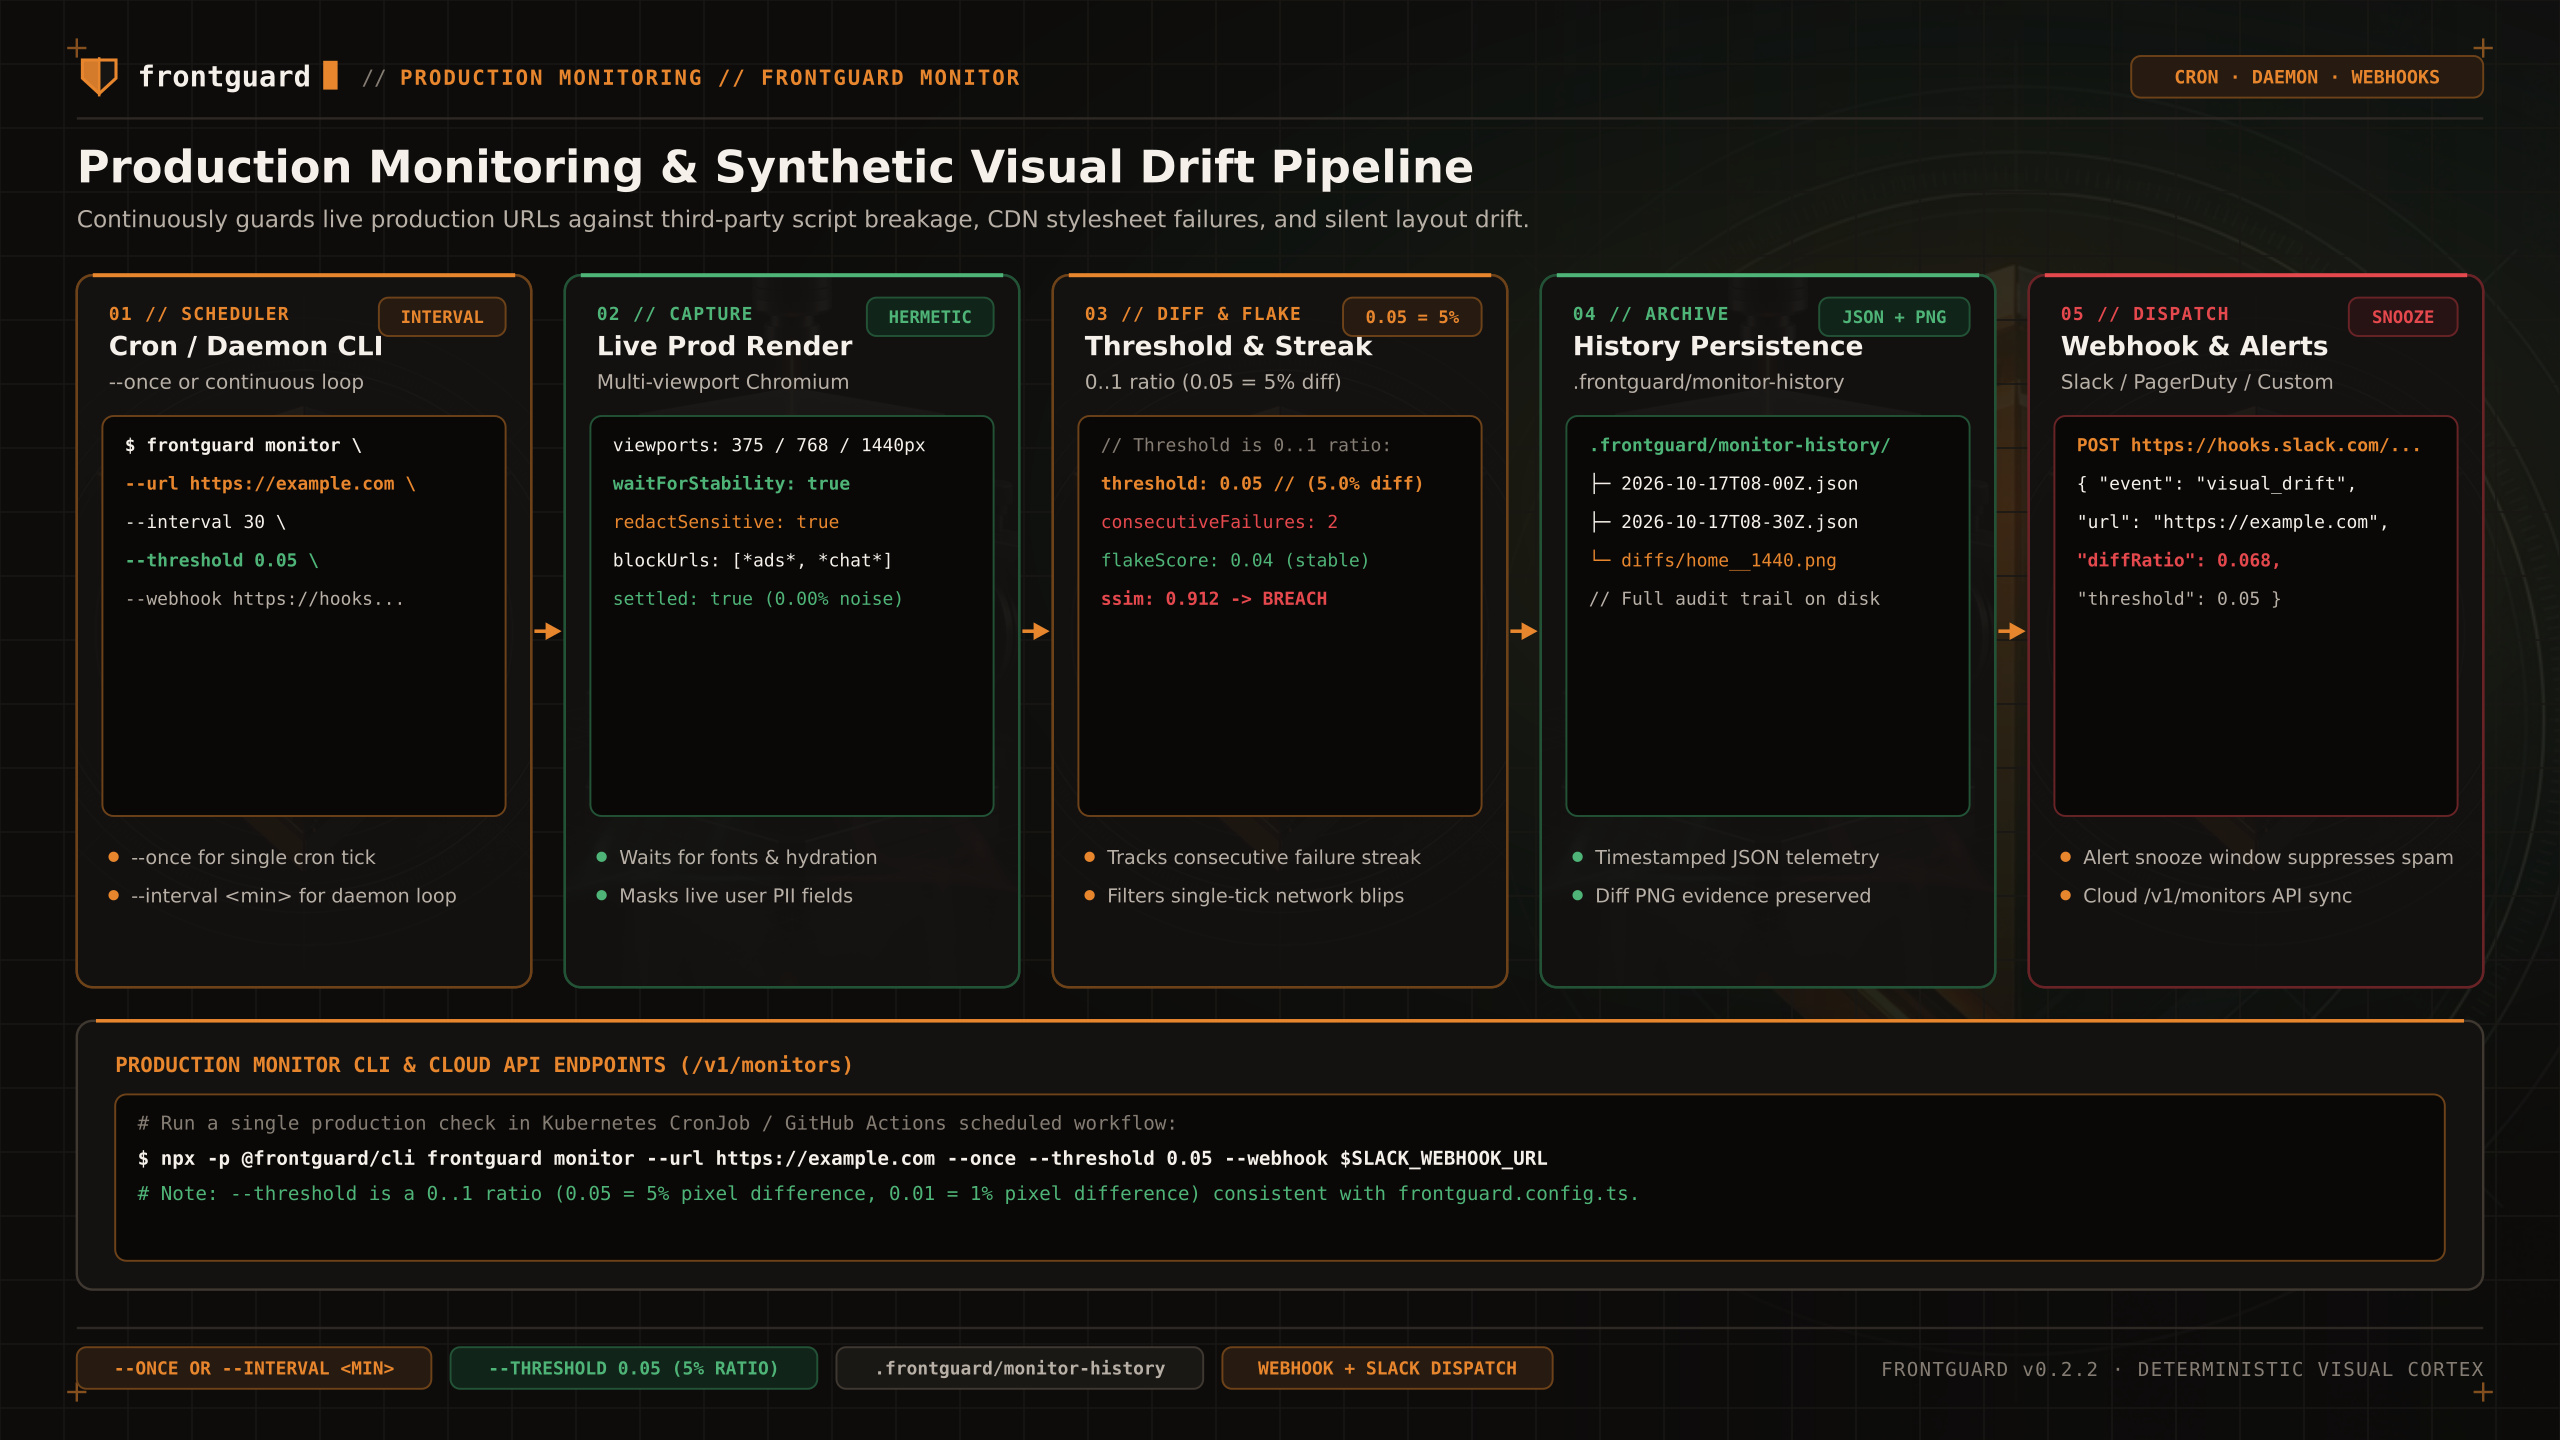
Local CLI
| Flag | Default | Description |
|---|---|---|
--url <url> | baseUrl from config | Live production or staging URL to monitor. |
--threshold <ratio> | 0.05 (5%) | Changed-pixel ratio required to trigger a monitor alert (0-1 scale). |
--once | false | Execute a single check and exit immediately (ideal for Kubernetes CronJobs or GitHub Actions schedule). |
--interval <minutes> | unset | Poll every N minutes. Without --interval or --watch, run once. |
--watch | false | Continuously poll; default interval is one minute unless --interval is provided. |
--webhook <url> | undefined | HTTP endpoint accepting Frontguard JSON alerts. Slack Incoming Webhooks require an adapter; see the Slack integration guide. |
--history | false | Print the local run history log stored under .frontguard/monitor-history. |
Scheduled cron recipe
Because frontguard monitor --once exits non-zero when a production regression exceeds threshold, you can run it on a 15-minute or hourly schedule in GitHub Actions or any cron runner:
History
CLI monitor records run history under .frontguard/monitor-history by default. Webhook failures are reported but should not be treated as a durable paging system.
Hosted status
Self-triggered cron or CI execution is the supported production monitoring workflow today.